


Information is the oil of the 21st century, and analytics is the combustion engine.” – Peter Sondergaard
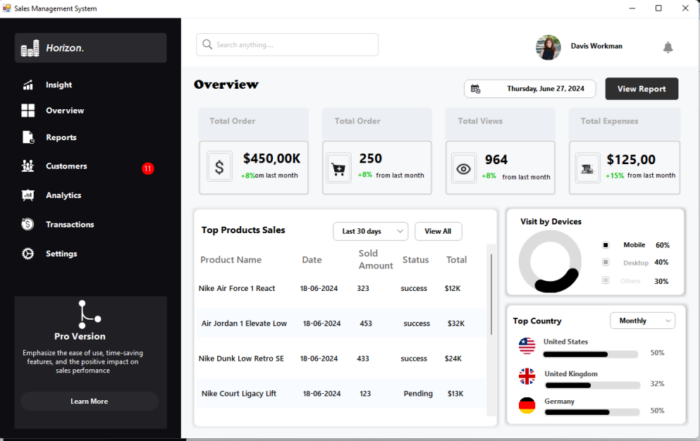
In this article I’ll show you the process of designing a broadcast analyzer dashboard powered by Bunifu Framework for desktop interface that is generally robust in terms of its features for instance views, watch time, subscribers and the revenue.
We will be using the Bunifu.UI.WinForms -Version 5.3.0 that has improved controls’ set.
How about we have a quick look at what we will achieve:

Controls Featured
Here’s the controls’-set highlighted on the dashboard:

Requirements:
You are required to download Icons8, Just color picker and Visual Studio software. Just color picker is a software that helps to choose a good color. Having downloaded Icons8, create a folder for the icons in your Documents or Pictures folder where we’ll be dragging the icons selected and then later importing them to our project in Visual studio.
The Design Process:
- The first thing we need to do is to start a new project in Visual Studio, then choose a C# Windows Forms App(.NET Framework) project and name your project “Screen Application Demo”.
- After the Form 1 is opened, you are supposed to open the properties window. Adjust the Auto scale mode= None. Font= Century Gothic:Regular:10. Forecolor= 64,64,64. Window state= Maximized. Size= 1284,700. FormBorder Style= None. Backcolor= 249,249,249.
- The next move we should perform is to open the Tool Box section and choose Bunifu panel. The 1st bunifu panel you use the dock property to dock to the Top and the 2nd bunifu panel you dock to the Left.
- Here’s what we expect to the current form:
")
The 1st Bunifu panel
- Drag bunifu Picture Box from the Tool Box and add the logo that you had already downloaded from icons8 and was stored in a specific file.
- Drag three bunifu label and place the 1st and 2nd bunifu label on the top-left side of the panel next to the logo and name it “C# Bunifu User Interface” and “Think, Develop Implement” respectively. The 3rd bunifu label should be placed on the top-centre of the panel and write “Welcome To Bunifu Television”.
- Drag bunifu TextBox from toolbox and write the text “Search Here”. Lastly, drag four bunifu button from the toolbox and place notification icon, send icon, minimize icon and cancel icon.
- The final output for the 1st panel should look similar to this:
")
The 2nd Bunifu panel
- Next, drag bunifuButton to the 2nd panel, resize its width to match the panels’ width then set the following properties:
IdleFillColor: 249,249,249
IdleBorderColor: Black
Forecolor: Gray
Font: Century Gothic,Bold,10
Text: Dashboard
TextAlign: MiddleLeft
TextPadding: 35,0,0,0
OnHoverState:
BorderColor: 30,170,231
FillColor: 30,170,231
IconLeftImage:(set your appropriate icon)
OnPressedState:
BorderColor: Black
FillColor: Black
- Copy and paste four other bunifuButtons, then here you need only to change the icons and text that are in hover and idle state.
- Lastly, you need to drag the bunifu picture Box from the ToolBox and insert a suitable icon that you had already downloaded. Below it, you are supposed to insert bunifulabel and add a text “100.0K Subscribers”. After that, insert bunifubutton and place the question mark icon.
- The final yield for the left panel should seem like this:
")
The 3rd Bunifu panel
- Drag bunifupanel and dock to the top below the 1st panel, then change BorderColor: Black.
- You need to drag 2 bunifuLabel and name the text as “Television Summary” and “Last 30 days” respectively.
- Add bunifuGradientPanel to the bunifupanel and set the following properties: Size: 240,140 BorderRadius: 20 GradientBottomLeft: Blue GradientBottomRight: White GradientTopLeft: White GradientTopRight: Blue.
- Drag three bunifulabel to the bunifu Gradientpanel and change text to; “Views”, “405K” and “5 % less than Usual”. Then drag a specific icon you had downloaded and place it in the bunifugradientpanel.
- Lastly, you should copy and paste three other bunifuGradientpanel, then here you need only to change the icon and the three bunifulabel text to match the content.
- The final output should look similar to this:
")
Visualization
- Drag bunifupanel from the ToolBox section and place it below the 3rd bunifupanel and set properties as follows: Dock; Fill Backcolor; White
- Add two bunifuLabel to the bunifupanel and in the text property, set text as “Television Summary” and “Visualization using chart” respectively.
- Add a cartesian chart and then add the code below related to running the chart:
- After completing the code section, lets now preview the complete cartesian chart :
")
- Finally, add bunifupanel to the bottom right of the dashboard and set the following properties: Dock:Right
- Next, add 3 bunifuLabel and set the text in the text properties as; “Bunifu Television”, “Bunifu Television helps software developers to gain knowledge for creating good and responsive UI/UX” and “Powered By Bunifu Framework” respectively. Then, add bunifu Picture Box to the bunifuPanel and insert statistics icon that you had downloaded from Icons8.
- Your output should look like this:
")
Conclusion
UI design is what makes an interface beautiful and it improves User experience. Bunifu UI Framework has helped us create this beautiful dashboard. I hope this inspires you to create more inspirational dashboard using Bunifu UI framework.
- Happy coding, designing and implementing!
How to design Bunifu Broadcast Analyzer Dashboard
Information is the oil of the 21st century, and analytics is the combustion engine." – Peter Sondergaard In this article I’ll show you the process of designing a broadcast analyzer dashboard powered by

Package Update – Bunifu UI WinForms Version 7.2.0 release
With the Bunifu .NET UI Framework, creating beautiful user interfaces is greatly simplified. You don't need to be an expert designer to produce modern and high-quality interfaces; Bunifu .NET UI Framework handles it for
Designing a StoreShop Dashboard with Bunifu UI in C#
How I Designed a Store Shop Dashboard with Bunifu UI in C# In this article we will be creating an inspiration desktop dashboard, using Bunifu UI and Microsoft Visual Basic Powerpacks controls that we
Designing a seamless Cryptocurrency UI Dashboard using Bunifu Framework in C# and VB.NET
How I designed a Cryptocurrency UI/UX Dashboard for Sales Management In this article we will be creating an inspiration desktop dashboard inspired by Bragas Prayogo's concept for Morva Labs. We will be using
Creating a Cryptocurrency Dashboard with BunifuUI and WinForms
Welcome to our interactive guide on creating a sleek cryptocurrency dashboard using WinForms and BunifuUI in Visual Studio Code! Whether you're a seasoned developer or just starting, this step-by-step tutorial will help you design

Bunifu UI WinForms 7.0.0 release with .NET 8 support
We are excited to announce our 2024 Bunifu Framework first release - Bunifu UI WinForms version 7.0.0. Bunifu UI WinForms version 7.0.0 features support for .NET 5, 6, 7, and 8 platforms. Specifically, we

Leave A Comment